Awesome road safety data
The NSW Transport's Safer Roads Program have collated awesome metrics for hundreds of road characteristics within our state. These are used to support evidence-based decisions and help apply treatments and fix problems before accidents happen. However, this data is spread across multiple datasets and has required significant technical expertise and time to access and understand it. Our challenge has been to make this data easily accessible, queriable, and presented in meaningful reports for road planners.Safer roads portal
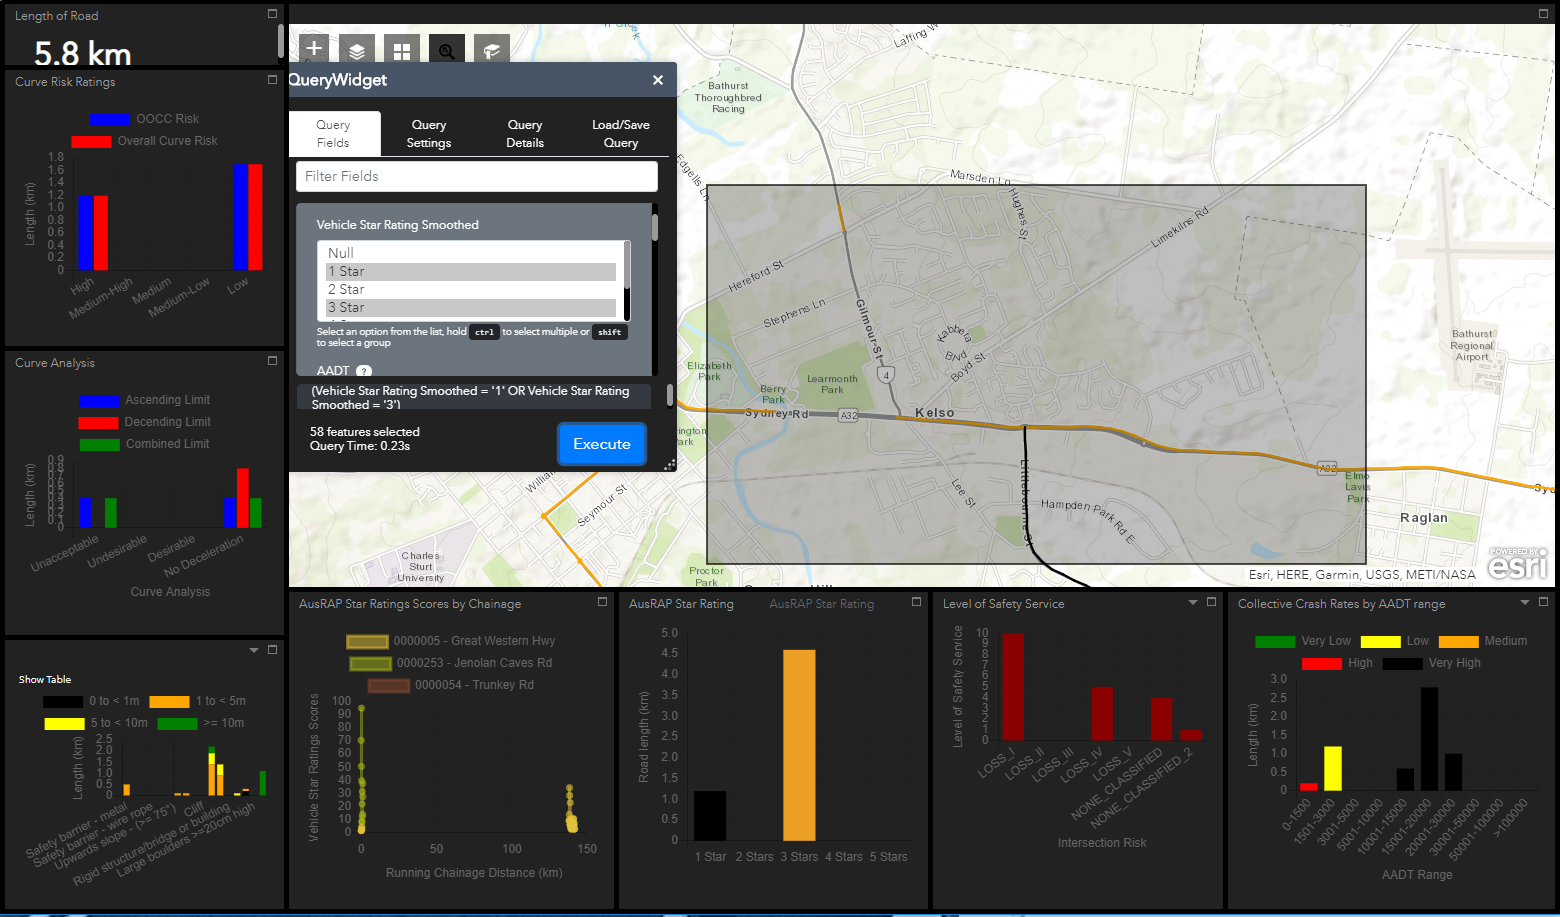
So we've built a web application to query and present road data. It supports queries such as:
“Find all 80km/hr road sections, with a risk rating between 1 and 3, with roadside obstacles within 10m of the road, along two selected routes in my council area.”Results are displayed in real-time in a map and charts. Queries can be iteratively refined and improved by the analyst, and then printed as a PDF report.
Technical challenges
The technical obstacles we've faced are worth sharing with others wanting to tackle similar use cases.
Multiple misaligned models
Our users' queries need to access road attributes from multiple sources. It might track the road's centerline in one dataset and track each lane in another. And the roads are segmented differently in each dataset. The spatial queries across multiple layers are very CPU intensive and resulted in unacceptable query times for our state-wide dataset.
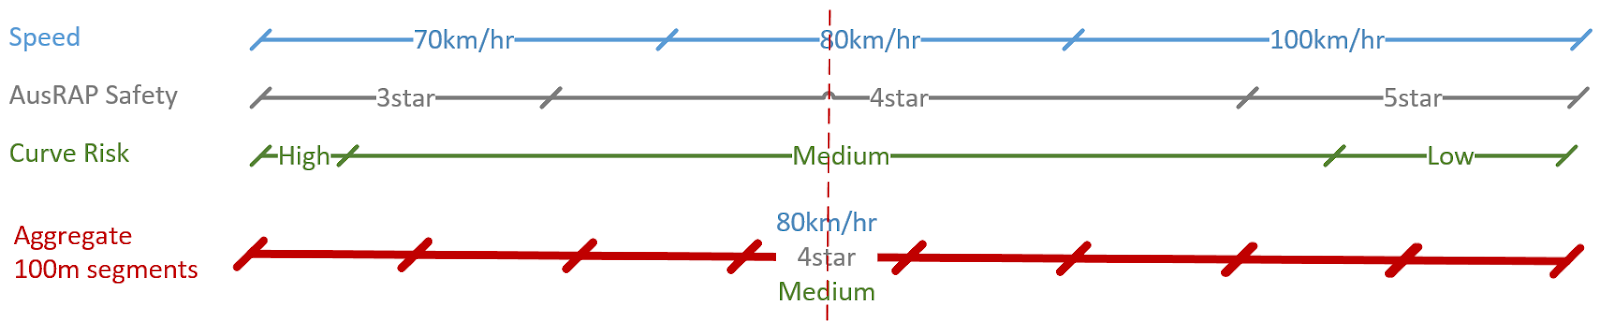
We addressed this by creating a master query layer, with roads divided into 100m segments, with each road segment aggregating all attributes from the source datasets.
We think we can improve this approach even further by moving to 100m x 100m map tiles for our query layer. This will make our query layer more tolerant of mismatched source layers and will allow us to integrate point and polygon layers.
Platform hacking
We built upon ESRI's ArcGIS Portal Web App Builder. It allowed us to quickly prototype a map and charts website. However, our use case pushed past the capabilities of ArcGIS Portal (and ESRI’s newer Experience Builder). We adding extensions and pulled in additional open source libraries. Notably:
- We replaced graphs with the more powerful Chart.js.
- We needed to support the circular refinement of queries, between both spatial and attribute queries, without re-starting the query. This required switching software to using a Model/View/Controller design paradigm, which also fixed up widget communication mixups we were having.
- The size of our dataset resulted in significant performance challenges. Initial queries crashed browsers, and first-round optimisation still caused ~ 10 minute response times). However, our data is relatively static, and this has enabled us to introduce database optimisation, tiling, caching and clustering strategies to bring standard query times down to web usability norms.
Open source options
In retrospect, we've realised that we've needed more than the capabilities of Web App Builder, and that the open-source stack of software would have suited us better. It would:
- Provide the full suite of capabilities we require.
- Address limitations with our current platform that we are having to work around.
- Be relatively easy to migrate to, comparable to upgrading to ESRI's latest Javscript API.
- Align with government open source recommendations.
- Allow other agencies to deploy our application without license restrictions.
- Allowed us to scale without license restrictions.
- Still facilitate integration with our ESRI based applications by using OGC open standards.
Reusable?
So are there others trying to solve a similar use case who want a copy of our codebase? People interested in collaboration, providing a business case for us to share our code? I suspect so. At the very least, there are our state's regional road authorities, and probably also local government authorities. But I expect our equivalents all around the world would be interested. If you are one of these people, then please reach out to us.
About the author
Cameron Shorter was the geospatial business analysis on the project.