Thursday 28 December 2006

5 steps for community building

An interesting article from Amy Jo Kim on what makes games and websites addictive. http://www.we-make-money-not-art.com/archives/008152.php

  1. Collecting
  2. Earning Points
  3. Feedback
  4. Exchanges
  5. Customization
I see many parallels with the Open Source development I participate in.
Developers collect credibility and earn status by submitting code and answering questions. In particular, good developers are given write access to the repository - a priveledge that needs to be earned. This status is remembered when asking for help.
Feedback is provided by the community when reviewing code or following an email thread.
There are numerous exchanges over email and chat sessions where relationships are built.
Customization probably can be considered as code that is developed.
No wonder I find Open Source development so addictive.
Even so, there would probably be other ways to strengthen these drivers. For instance:
  1. We could automatically collect statistics for users and display them publicly. Like lines of code written, bugs fixed, questions answered which could all be aggregated into an overall rating.

Sunday 15 October 2006

AJAX Vector Rendering design

Continued development of this design has moved to http://wiki.osgeo.org/index.php/AJAX_WebMapping_Vector_Rendering_Design .


This design aims to be a summary of ideas from Mapbuilder, OpenLayers, and webmap-dev communities regarding vector rendering design.
This is not supposed to be the final design, but rather draft to be used to facilitate further discussions.
My hope is that the final version of this design will be used by all the AJAX webmapping clients to make sharing the same code base easier.
I'd like to credit Patrice Cappelaere who has SVG/VML rendering working in Mapbuilder and deployed at GeoBliki. This design aims to extend Patrice's code to be more generic and extensible.
Vector Layers Class Diagram


Layer/Renderer Class DiagramThe key here is that the DataSource (or Layer) is being kept seperate to the Rendering mechanism. This is a graduation away from existing OpenLayers code which previously merged the DataSource and Rendering in the same Object.
Graphics Class Diagram
There are opportunities for collaboration with other projects/libraries in this Graphics package.
In particular:
  • This Graphics library should be able to stand alone as a graphics rendering library, independant of the Geospatial side of the code. It can then be packaged up and used for other AJAX clients requiring Vector rendering graphics.
  • ExplorerCanvas is a cross browser Canvas library. This could be extended to support SVG, WZGraphics, Flash etc.
  • http://starkravingfinkle.org/blog/2006/03/svg-in-ie is worth watching too.
Parsers Class Diagram
MouseEvent Processing Class Diagram
MouseEvents can be attached to each SVG/VML shape. This means that we can add functions like:
  • Popups when a user hovers over a feature.
  • Select a feature when a user clicks on the feature.
  • Select a vertex when a user clicks on a vertex. (This would require a shape to be drawn on each vertex of a line being queried).
Initialisation Sequence Diagram
Paint Sequence Diagram
Use Cases from John Frank
John Frank did an excellent job outlining the major use cases for Geospatial Vector Rendering:

Better vector data support in OpenLayers will help many of us. I am totally in favor of it. To reality check the proposed design, I'd like to see a few use cases sketched out. Here are a few that seem important to me. Each use case has two components: a user interface challenge and a datastructure challenge. There will typically be many solutions to the user interface challenge; I'm suggesting we think of at least one UI solution to check the proposed nouns and verbs. The canonical "user" is always a very Tough Customer, so I use that as though it were a person's name, and their initials are TC 1) An open polyline and also a point are rendered on the screen. TC wants to *add* the point to the polyline to increase its depiction of some underlying reality. How does TC specify where in the line to add the point, and how do these classes handle that insertion? Logically, the input needs to specify which existing segment of the polyline to break and replace with two new line segments. 2) Continuing one: TC wants to move an existing point in a polyline... 3) TC constructs a sequence of points by clicking in the map, and wants to see those points connected together in a polyline. Naturally, TC will construct a self-intersecting path. What is the sequence of method calls? 4) After loading several vector data layers from various sources, TC wants to merge ten different features together into one "thing" that can be stored separately. How does she do that? What happens in the code? How does it keep track of where the data came from originally? 5) After loading a vector data layer that may or may not have come with styling information, TC wants to change the styling information used in presenting that data on her map. Using some eye candy on the screen, she can input some choices, and then: what are the sequence of actions under the hood? 6) Continuing four: TC wants to change the *displayed position* of a point or a line without changing the underlying data. As cartography, each map's visual appearance communicates information that a particular scale might not permit the raw data to easily reveal. The canonical example was shown at the ESRI UC a few weeks ago: two road segments are distinct, but at a particular scale, the cartographic styling makes them appear so wide that they merge visually. The best known solution to this is to actually move one of the line's pixel position to visually indicate the merger. What is the sequence of steps and what datastructures change? How are the styling choices associated with the chosen scale? 7) After laying out a sequence of points that form a closed polygon, TC wants to know the area and perimeter of the polygon. How does this information get calculated and passed out? 8) A group of cyclists documents their summer trip in a data set with a long polyline covering four thousand miles miles and various point features with interesting styling and labels. TC wants to *play* the story in an OpenLayers map. By "play," I mean the video analogy of having a stop/play forward/play backward button, fast forward and fast backward buttons, and when the system is in action, the map automatically moves and the popups automatically appear as the map moves along the route at some scale specified in the styling made by the cyclists. What data structures represent the cyclists' details? What sequence of methods cause the movie to play? 9) TC gets assigned a task: digitize all the roads in Madagascar using this 60cm satellite imagery. How does this design make that easy? I realize that some of these may get cast out of initial designs as being too advanced for our first pass. However, I think such a choice should be made consciously.

Thursday 14 September 2006

Dunbar number - size of effective groups

Very interesting talk by Christopher Allen at http://www.itconversations.com/shows/detail1072.html

"The Dunbar number is a measure of the cognitive limit to the number of individuals with whom a person can maintain stable relationships. The concept has intrigued sociologists and anthropologists since it was first recognized as the correlation between brain capacity and group size in primates. In this talk, social software observer Christopher Allen discusses the interesting implications the Dunbar number theory has for the gathering of humans on line in the digital age. "

The dunbar number = 150. Number of people in an effective group based on amount of time that you need to dedicate to social grooming.
Group sizes:
* Small < 10. Intimate. Good size for chats sessions.
* Medium ~ 100 people. Email lists. Wikis.
* Large > 150. Trust needs to be built into the application. (Eg like slashdot)

Friday 4 August 2006

Business Model for Measurement Repository tool using Open Source

ADI should build a business around the Measurement Repository tool it is building by using an Open Source business model.
ADI is about to develop an in house Measurement Repository tool to address CMMI requirements for project measures.
This will be an effective, professional tool that has the potential to be sold to the broader community. There are currently no plans to sell the tool as the cost of promotion probably outweigh potential sales.
ADI would do well to Open Source the core Measurement Repository software and make money by selling services to the Software.
Key benefits from open sourcing the software include:
  • ADI can sell software module enhancements for enterprise customers.
  • ADI can sell support to enterprise customers.
  • Open source developers will enhance the software and ADI will benefit from these enhancements.
Key requirements needed to make this business model a sucess.
  • The software needs to be built upon Open Source components so that users can download a free product.
  • ADI needs to retain ownership of the source code.
An excellent example of how this business model has been applied is Sugar CRM as explained in an interview at http://www.itconversations.com/shows/detail1137.html.

Thursday 3 August 2006

How to innovate in a large company

For a large company to behave as inovators, it needs to set up small, disconnected divisions within the company which can act like a startup company. This is the theme of a speech by Mark Bregman, chief technology officer of Symantec. http://www.itconversations.com/shows/detail1032.html
My employer could do well to take note. Two of my employer's key values are:
  • Develop People
  • Behave as Entrepeneurs and Innovators
I've been actively trying to build a new business line within my company based on building Geospatial Open Source solutions. My goal has been to win small contracts, build credability and then become a contendor for larger work. We have had a few wins but have had more lost opportunities because:
  • The opportunities are small and have not been given the priority required for small jobs.
  • The processes of large contracts are being forced upon small jobs and making ADI uncompetitive.
Typically, large companies buy small innovative companies to get inovation into their product suite. However this has downsides:
  • It is usually difficult to retrofit products from the small company with existing products in the large company.
  • Innovative employees from the small company are less likely to want to work in a large company without an opportunity to innovate.

Tuesday 11 April 2006

Community Mapbuilder State Of Play - April 2006


Abstract

This document summarises the state of the Mapbuilder project and it's relationship with projects around it, identify upcoming features and opportunities, and suggest where to focus future effort and funding to maximise Mapbuilder's potential.

There has been a significant increase in developers downloading and extending Mapbuilder code. To maximise Mapbuilder's potential for developers, users and sponsors, the focus of core developers should move from development toward supporting and mentoring new developers. Similarly, sponsors should dedicate part of their funds to Mapbuilder mentors. Sponsor one mentor and you get five developers for free.

1. What is Mapbuilder?

Mapbuilder is a modern, web based geographic mapping client. It's modular design has made it easy for developers to build an every increasing library of widgets and tools to plug into Mapbuilder. In particular, Mapbuilder stands out from other Webmapping clients because it allows users to draw vector features on a map then load the feature into a Transactional Web Feature Service.

Mapbuilder is built upon OGC standards and hence is interoperable with many other Geospatial applications.

Mapbuilder has grown a strong, diverse and active developer community and as Mapbuilder reaches it's 1.0 release it is being recognised as a quality product. Mapbuilder is bundled with Geoserver, an Open Source Web Map Service (WMS) and Transactional Web Feature Service (WFS), and Mapbuilder was selected as one of the founding projects for OSGeo, the Open Source Geospatial Foundation.

2. What big ticket items are in the pipeline?

2.1. Geographic wiki

Web Mapping to date has focused on Publishing mapping data. Feature entry functionality is being added to Mapbuilder which will allow users to create, edit, then upload geographic features.

2.2. Integrated Suite of Open Source Mapping products

There is a full range of high quality open source geospatial software which interacts which each other using Open Standards - however the installation and configuration of these products is still disjointed. Over the next few years, these projects are likely to integrate more closely providing easy to install and configure solutions.

In particular, Mapbuilder is currently bundled with Geoserver, an open source WFS/WMS, and there is an opportunity for Mapbuilder to be bundled with Udig to provide a heavy/light client solution.

2.3. Roll your own Webmapping Client

Imagine a web page which looked like a drawing program like Visio. On the left is a list of widgets which can be dragged onto a Pane on the right. After the user has selected and placed their widgets, the use can assign attributes like Map Layers.

http://www.netvibes.com/ uses a similar concept which made it very popular.

2.4. AJAX drawing tool

Mapbuilder has developed effective drawing functionality which would be useful for a wide range of applications. This should be factored out into a separate library so that it can be used by other applications.

2.5. Lots of extra widgets and features

Google and Yahoo Map layers, fast vector rendering of features (eg using SVG), tiled maps, and much more.

3. Managing growth

Figure 1. 

Over the last year Mapbuilder has had a steady increase in interest from developers and users. Traffic on our email lists has increased by a factor of five over the last year. Increasingly we are seeing questions from paid portal developers who extend Mapbuilder, then move on. Since most core developers work on Mapbuilder in their spare time the core developers are having problems supporting users and incorporating the user's code.

Almost all Mapbuilder queries are from developers, which is an indication that Mapbuilder documentation and installation procedures are too difficult for average internet users.

Mapbuilder's user documentation is still poor which is part of the reason for the large number of user queries. Improving documentation will empower users to answer their own queries, and will increase Mapbuilder's user base because more people will be able to use it.

4. Funding

Mapbuilder has grown to privileged position where we are starting to have access to more developers than the core team can support. To accept developer contributions, we need to provide guidance, answer technical questions, review code and incorporate additions into the code base. Part of the support can be provided by writing good supporting documentation.

If you are considering using or extending Mapbuilder, sponsoring a Mapbuilder mentor will probably make sense for you. Sponsor one mentor and get five developers for free. For a company who wants to extend Mapbuilder, I suggest you hire a developer to implement your desired features and a mentor for 1/5 of your developer's time. This will ensure your code is reviewed and incorporated into the Mapbuilder codebase and available in future Mapbuilder releases. If your desired functionality is popular, it may be more economical to just support a Mapbuilder mentor which in turn will empower other Mapbuilder developers to implement features on your behalf.

5. Integrating with projects around us

The commercial world regularly tries to out do and compete against similar projects, but in Open Source we can do much better by embracing and working together.

5.1. Web mapping clients

There are a number of web mapping clients doing similar things to Mapbuilder or with features that Mapbuilder would like to copy. The projects all contain talented software developers and we would all do better if we could share our workload and focus on one great product instead of lots of good products.

Unfortunately it is difficult to merge two code bases together and no one wants to give up a project they have spent lots of time on to go and work on someone else's code.

So what I propose is that we work toward a long term goal of merging projects. We start by gradually factoring out common libraries that we work on together, and whenever we make future design decisions, we run the idea past other projects and see if we reuse code or interfaces which will ease merging some time in the future. webmap-discuss@lists.osgeo.org has been set up to facilitate this.

5.2. OpenStreetMap and other Geowikis

http://www.openstreetmap.org/ is a project which allows users to upload tracks from GPS devices (like handheld computers or phones) into a geographic database, then provides a java applet to edit those same features. They have addresses some of the hard issues, like version control on features at the expense of breaking away from Open Standards. And they are already collecting data from users.

This is a project that would be great to work with. They have a great vision, and some good ideas. We could add value to them by providing our AJAX based web mapping client - they have a Java applet. Java applets are a stumbling block for many non-technical users because it requires them to download and install extra software into their browser. We could help them migrate toward a standards based solution, which would enable them to tap into other powerful mapping applications (like UDig).

There has been talk on Wikipedia about setting up a geographic wiki. Mapbuilder could be the tool used for a Wikipedia for geographic maps.

5.3. Basemap providers

There has been an explosion of quality free basemaps on the internet from companies like Google, Yahoo, and MSN. These companies also provide viewers which could be seen as competitors to Mapbuilder. These companies could be seen as potential sponsors for the Mapbuilder project as their code value is in their maps, not the mapping client.

5.4. AJAX Engines

Mapbuilder has built it's own AJAX software - (software which handles asynchronous loading, events, javascript inheritance etc). It is powerful, and it works, however some of the code is not very elegant, and because we were experimenting as we wrote it, we have instances where concepts like inheritance are implemented in two different ways. This makes the code harder to understand and more prone to bugs.

Since we wrote Mapbuilder, there have been a number of quality AJAX Engines written. It would be wise of Mapbuilder to replace our engine with one of the dedicated engines. The advantages would be: more reliable code, maintenance would be spread across a larger user base and we can tap into the expertise of the developers on these projects.

5.5. Geoserver

Geoserver is a Java based Transactional Web Feature Service (WFS-T) and Web Map Service. Mapbuilder is currently bundled with Geoserver which probably explains why a number of our quality developers have been attracted to Mapbuilder.

We need to ensure that Mapbuilder continues to be bundled with Geoserver and ensure that Geoserver ships with the latest version of Mapbuilder.

5.6. UDig

UDig is a powerful GIS desktop application. It would be very useful for users to bundle Mapbuilder with UDig to provide a light/heavy client option.

5.7. Open Web Services Testbed (OWS4)

The OWS4 testbed sponsored by the Open Geospatial Consortium would be an excellent opportunity to show case Mapbuilder and UDig integration.

6. Areas for improvement

6.1. Documentation

Mapbuilder's documentation needs to catch up to the quality of the code. By improving our documentation, we won't need to keep answering the same questions on email lists and will increase our user base. Increased users, means increased developers and sponsorship and a healthier project.

The catch is that the people who know the most about the code (the developers) don't need the documentation and sponsors often want to pay for a feature and move on. Good documentation is a long term investment in a project.

6.2. Testing

It is a credit to the Mapbuilder team that Mapbuilder is so stable considering that it targets the flaky browser platforms.

To date Mapbuilder has only just started looking at automated testing, however it has not been rolled out across the project. Automated testing will help ensure Mapbuilder remains stable and give us confidence to take on more developers.

6.3. Core code

Mapbuilder's code has gone through many improvements as we have pioneered and experimented with AJAX techniques. As such there are areas of code which still contain old hacks and plenty of areas where we could simplify code. This would reduce download size, reduce complexity and improve maintainability.

We should do a systematic code review and clean up and improve our existing core code, and replace some of our code with standard AJAX libraries.

6.4. Managing new developers and funding

We have become overwhelmed with new developers and their questions. This is a good thing, but we do need to change the way we do things. In particular, the core team needs to focus more on Mentoring new developers. Ideally, sponsors should consider sponsoring a Mapbuilder mentor. Sponsor one mentor, get five developers for free.

6.5. Visibility

To build the project's profile, we should present Mapbuilder at various conferences.

Wednesday 29 March 2006

Issues with Google Maps and Web Map Server (WMS) Mashups


I've been integrating a Google Map layer into Community Mapbuilder - a web mapping client so that we can display Web Map Server (WMS) layers over a GoogleMap base.
However, we have run into problems with Spacial Reference Systems (or projection). A projection is a way to describe a spherical world on a flat piece of paper.
The WMS specification (as defined by the Open Geospacial Consortium) defines thousands of different Spacial Reference Systems using EPSG codes. For example, simple (lat,long) uses EPSG:4326. And a WMS request looks something like:

http://www2.demis.nl/WMS/wms.asp?wms=WorldMap&wmtver=1.0.0&request=map&layers=Builtup+areas,Railroads,Highways,Roads,Trails,Borders,Cities,Settlements,Airports&srs=EPSG:4326&bbox=-160.14,-3.37,-19.69,55.23&amp;amp;amp;amp;width=800&height=400&format=image/gif&styles=default&transparent=true&uniqued=

Unfortunately, the Mercator projection & datum used by Google Maps does not have a corresponding EPSG code.
Consequently, as far as I can work out, it is not possible to use a standard way to request a WMS map which is in the same projection as Google Maps.
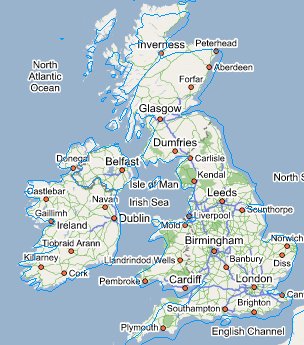
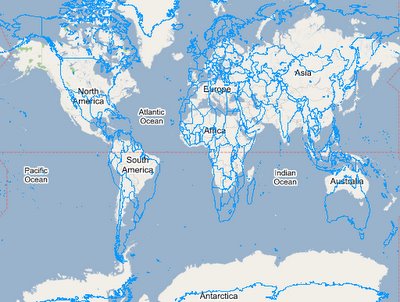
Existing WMS/Google Map mashups I've seen on the web so far use EPSG:4326. This projection is reasonably close if you zoom into a city, but is out by miles if you look at a map of the world. (See images).
Recommendation
  1. Google, the OGC, and the owners of EPSG codes should get together and define a new EPSG code so these two types of maps can be incorporated together.
  2. I'm guessing option 1 will take a while. So in the mean time, WMS servers and WMS clients (like Mapbuilder) should define our own EPSG code to use in the interum. Maybe EPSG:Mercator?
Disclaimer
I'm a programmer, not a geographer, so I'm likely to have some of the geographic terms incorrect.
Update 30 Sept 2006
John Deck has blogged describing a work around to rendering WMS on Google Maps at
http://johndeck.blogspot.com/2005/09/overlaying-mercator-projected-wms.html and then an update at http://johndeck.blogspot.com/2006_02_01_johndeck_archive.html.
Open Layers have incorporated a hack into their codebase which includes stretching the WMS layer to fit. This will still have distortion issues as the projection of the WMS and Google Map use different projections.
The best solution would still be if a new EPSG code were created for GoogleMap layers.

Friday 24 March 2006

Why does Open Source achieve better CMMI than CMMI practitioners?

(Rough thoughs that I hope to build into an essay.)
  • What is CMMI?
  • CMMI level 3 involves common processes across an organisation to ease.
  • In a corporation, this means Processes and Tools are mandated from the top of a company down. Tools are often selected and then mandated by Management.
  • In corporations, innovation in processes and tools are often stifled in a drive to try and maintain common processes across the corporations.
  • OS achieves common processes across projects without having a mandate from the top. Eg: Most OS projects are now moving to Subversion for Configuration Management.
  • Difference: Practictioners choose their tools based on their merits. The best tools become the defacto standard.
Why can't big companies compete on small contracts?
  • Big companies can't bid on small projects because they are not competative. Reason given is they have too many overheads. This should not be the case. The big company should be able to reduce overheads by using the economies of scale.
  • This implies to me that Big Companies are imposing inefficient processes on their staff.
  • Why can't a big company sponsor a startup division without imposing the company overhead.

Recommendation:
  • Allow each business unit to pick their own tools and processes.
  • Provide opportunities for business units to share experience and suggest tools.
  • Allow processes and templates to be developed as if they were an open source project.
Examples:
  • My experiences with CMMI and OS.